1. Introduction
Hypertension is a leading risk factor for cardiovascular diseases, contributing significantly to morbidity and mortality worldwide. It is estimated to cause approximately 9.4 million deaths annually and is strongly linked to an increased likelihood of stroke, heart attack, heart failure, and kidney failure
| [1] | Lim, S. S., Vos, T., Flaxman, A. D., Danaei, G., Shibuya, K., Adair-Rohani, H., and Pelizzari, P. M. (2012). A comparative risk assessment of burden of disease and injury attributable to 67 risk factors and risk factor clusters in 21 regions, 1990–2010: a systematic analysis for the Global Burden of Disease Study 2010. The lancet, 380(9859), 2224-2260. https://doi.org/10.1016/S0140-6736(12)61766-8 |
| [2] | Howard, G., Banach, M., Cushman, M., Goff, D. C., Howard, V. J., Lackland, D. T., and Taylor, H. A. (2015). Is blood pressure control for stroke prevention the correct goal? The lost opportunity of preventing hypertension. Stroke, 46(6), 1595-1600. https://doi.org/10.1161/strokeaha.115.009128 |
| [3] | Peters, S. A., Huxley, R. R., & Woodward, M. (2013). Comparison of the sex-specific associations between systolic blood pressure and the risk of cardiovascular disease: a systematic review and meta-analysis of 124 cohort studies, including 1.2 million individuals. Stroke, 44(9), 2394-2401. https://doi.org/10.1161/strokeaha.113.001624 |
| [4] | Baños-González, M., Cantú-Brito, C., Chiquete, E., Arauz, A., Ruiz-Sandoval, J. L., Villarreal-Careaga, J., ... & Lozano, J. J. (2011). Systolic blood pressure and functional outcome in patients with acute stroke: a Mexican registry of acute cerebrovascular disease (RENAMEVASC). Archivos de cardiología de México, 81(3), 169-175. |
[1-4]
.
Projections indicate that by 2025, the prevalence of hypertension could rise by 30%, with low- and middle-income countries (LMICs) accounting for nearly 75% of the global hypertensive population
| [5] | Kearney, P. M., Whelton, M., Reynolds, K., Muntner, P., Whelton, P. K., & He, J. (2005). Global burden of hypertension: analysis of worldwide data. The lancet, 365(9455), 217-223. https://doi.org/10.1016/s0140-6736(05)17741-1 |
[5]
. Currently, over 80% of the health burden related to high blood pressure is concentrated in LMICs
| [6] | Wang, H., Naghavi, M., Allen, C., Barber, R. M., Bhutta, Z. A., Carter, A., ... & Bell, M. L. (2016). Global, regional, and national life expectancy, all-cause mortality, and cause-specific mortality for 249 causes of death, 1980–2015: a systematic analysis for the Global Burden of Disease Study 2015. The lancet, 388(10053), 1459-1544. https://doi.org/10.1016/S0140-6736(16)31012-1 |
[6]
. In these regions, more than 70% of individuals receiving treatment for hypertension have uncontrolled blood pressure.
The primary goal of antihypertensive treatment is to prevent cardiovascular complications. Achieving target blood pressure levels is critical once drug therapy begins, yet studies reveal that only about 50% of patients on antihypertensive medication reach their control targets
| [7] | Ohkubo, T., Obara, T., Funahashi, J., Kikuya, M., Asayama, K., Metoki, H., ... & Imai, Y. (2004). Control of blood pressure as measured at home and office, and comparison with physicians’ assessment of control among treated hypertensive patients in Japan: first report of the Japan Home versus Office Blood Pressure Measurement Evaluation (J-HOME) study. Hypertension Research, 27(10), 755-763. https://doi.org/10.1291/hypres.27.755 |
[7]
.
Using a single drug often falls short of achieving desired blood pressure control
| [8] | Morgan, T. O., Anderson, A. I., & MacInnis, R. J. (2001). ACE inhibitors, beta-blockers, calcium blockers, and diuretics for the control of systolic hypertension. American Journal of Hypertension, 14(3), 241-247. https://doi.org/10.1016/s0895-7061(00)01266-8 |
[8]
.
Antihypertensive therapy typically starts with a single drug at a low dose. If side effects occur or the medication proves ineffective, switching to another drug class is recommended. When adequate blood pressure reduction is still not achieved, either increasing the dose of the initial drug or adding a second low-dose medication from a different drug class is advised. Studies have shown that combination therapy using two different classes of drugs at low doses tends to produce more effective blood pressure reductions than doubling the dose of a single medication
| [9] | Wald, D. S., Law, M., Morris, J. K., Bestwick, J. P., & Wald, N. J. (2009). Combination therapy versus monotherapy in reducing blood pressure: meta-analysis on 11,000 participants from 42 trials. The American Journal of Medicine, 122(3), 290-300. https://doi.org/10.1016/j.amjmed.2008.09.038 |
| [10] | Mahmud, A., & Feely, J. (2007). Low-dose quadruple antihypertensive combination: more efficacious than individual agents-a preliminary report. Hypertension, 49(2), 272-275. https://doi.org/10.1161/01.hyp.0000254479.66645.a3 |
[9, 10]
.
Clinical practice guidelines from numerous countries, professional organizations, and the WHO strongly advocate for the use of fixed-dose combinations in managing hypertension. These guidelines also recommend initiating treatment with two medications, particularly for individuals with significantly elevated blood pressure. Fixed-dose combinations of two drugs have been shown to improve blood pressure control more effectively than monotherapy, without leading to a higher rate of treatment discontinuation due to adverse effects. Enhancing hypertension control rates by 25% could significantly increase the number of individuals successfully managing their condition
| [11] | Whelton, P. K., Carey, R. M., Aronow, W. S., Casey, D. E., Collins, K. J., Dennison Himmelfarb, C., ... & Wright, J. T. (2018). 2017 ACC/AHA/AAPA/ABC/ACPM/AGS/APhA/ASH/ASPC/NMA/PCNA guideline for the prevention, detection, evaluation, and management of high blood pressure in adults: a report of the American College of Cardiology/American Heart Association Task Force on Clinical Practice Guidelines. Journal of the American College of Cardiology, 71(19), e127-e248. https://doi.org/10.1161/HYP.0000000000000065 |
| [12] | Mancia, G., Fagard, R., Narkiewicz, K., Redán, J., Zanchetti, A., Böhm, M., ... & Zannad, F. (2013). 2013 Practice guidelines for the management of arterial hypertension of the European Society of Hypertension (ESH) and the European Society of Cardiology (ESC): ESH/ESC Task Force for the Management of Arterial Hypertension. Journal of hypertension, 31(10), 1925-1938. https://doi.org/10.1097/01.hjh.0000431740.32696.cc |
[11, 12]
.
The combination of an angiotensin-converting enzyme (ACE) inhibitor and a diuretic offers distinct advantages over monotherapy in managing hypertension
| [13] | Pool, J. L., Gennari, J., Goldstein, R., Kochar, M. S., Lewin, A. J., Maxwell, M. H., and Weinberger, M. (1987). Controlled multicenter study of the antihypertensive effects of lisinopril, hydrochlorothiazide, and lisinopril plus hydrochlorothiazide in the treatment of 394 patients with mild to moderate essential hypertension. Journal of Cardiovascular Pharmacology, 9, S36-S42. https://doi.org/10.1097/00005344-198700003-00010 |
[13]
. ACE inhibitors mitigate the compensatory increase in angiotensin II typically induced by diuretic therapy, while thiazide diuretics can activate the renin-angiotensin system, thereby amplifying the antihypertensive effect of ACE inhibitors
| [14] | Opie, L. H. (1992). ACE inhibitors for hypertension. Angiotensin-Converting Enzyme Inhibitors: Scientific Basis for Clinical Use. New York, NY: Wiley-Liss, 20-54. |
[14]
. This synergistic interaction often proves effective for patients who do not achieve satisfactory results with ACE inhibitor monotherapy. Additionally, combination therapy allows for lower dosages of each component in some cases, reducing the likelihood of dose-dependent side effects
.
Some commercially available dual therapy fixed-dose combinations containing hydrochlorothiazide and ACE inhibitors are listed in
Table 1.
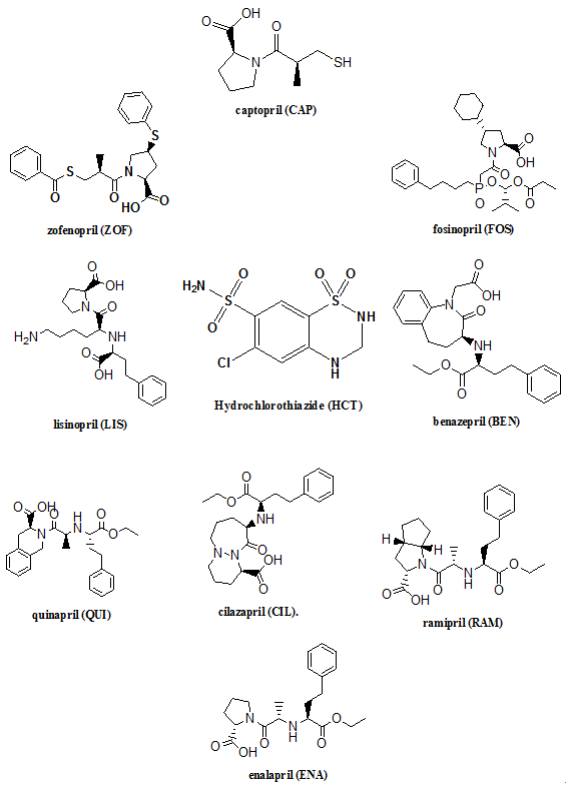
Despite all ACE inhibitors being 2-methylpropionyl-L-proline analogs, they are distinguished by their unique chemical structures, these agents inhibit ACE by forming a zinc-binding ligand
. Based on the molecular structure of their enzyme-binding sites interacting with the active core of ACE, ACE inhibitors are categorized into three classes: sulfhydryl-containing compounds, dicarboxylate-containing agents, and phosphonate-containing drugs (see
Figure 1 and
Table 2)
Table 1. Some commercially available dual therapy fixed-dose combinations containing hydrochlorothiazide (HCT) and ACE inhibitors (ACEI).
ACE inhibitor | ACEI/HCT mg/mg |
Benazepril | 5/6.25 |
10/12.5 |
20/12.5 |
20/25 |
Captopril | 25/15 |
25/25 |
50/15 |
50/25 |
Enalapril | 5/12.5 |
10/50 |
Lisinopril | 10/12.5 |
20/12.5 |
20/25 |
Moexipril | 7.5/12.5 |
15/25 |
Quinapril | 12.5/10 |
12.5/20 |
25/20 |
Table 2. ACE inhibitors chemical classes with examples.
Chemical class | Drug |
sulfhydryl-containing drugs | Captopril(CAP) |
Zofenopril (ZOF) |
dicarboxylate-containing agents | Lisinopril (LIS) |
Enalapril (ENA) |
Ramipril (RAM) |
Benazepril (BEN) |
phosphonate-containing medicines | Fosinopril (FOS) |
Hydrochlorothiazide (HCT) is a thiazide-type diuretic that inhibits sodium resorption in the distal convoluted tubules of the kidney. It has been shown to reduce major cardiovascular events. Hydrochlorothiazide is FDA-approved for treating essential hypertension either as a primary agent or an adjunct to other antihypertensive therapies
| [17] | Sweetman, S.C. Martindale: The Complete Drug Reference, 36th edition (2009), Pharmaceutical Press; London. |
[17]
.
Fixed-dose combinations of ACE inhibitors and hydrochlorothiazide are widely recognized as an effective option for managing hypertension and are readily available in the healthcare systems of many countries. However, to the best of our knowledge, no comprehensive review on the analytical methods for their determination has been published. This study aims to fill that gap by providing an in-depth review of the analytical approaches used for these combinations.
Figure 1. Chemical structure of hydrochlorothiazide and some ACE inhibitors.
The literature for this analysis was meticulously selected from accessible publications spanning 1990 to 2024. Journal articles were sourced from specialized databases such as Science Direct, Springer Link, PubMed, Scopus, and Google Scholar, using targeted search terms like "analytical method for determination of hydrochlorothiazide and ACE inhibitor combination" and "determination of hydrochlorothiazide and ACE inhibitor group members."
Each identified article underwent manual screening based on its title and abstract to ensure relevance. Duplicate records and studies that did not align with the research scope were excluded. The selection process adhered to predefined inclusion criteria, which required that studies:
1. Be original research published in peer-reviewed journals.
2. Present analytical methods for determining hydrochlorothiazide and ACE inhibitor combinations.
3. Focus on quantification in pharmaceutical dosage forms.
4. Be published in English.
Studies that did not meet these criteria, including those published in languages other than English, were excluded from the final analysis
The key findings from the selected studies were systematically summarized in comprehensive tables, detailing essential parameters such as the analytical matrix, method employed, detector type and detection wavelength, stationary and mobile phases, flow rate, linearity range, and limits of detection (LOD). This structured presentation allowed for a clear comparison and interpretation of the various analytical methods reviewed.
2. Chromatographic Methods
Various chromatographic methods are used for the determination of complex mixtures of drugs in various marketed formulations. Chromatographic methods like reverse-phase high performance liquid chromatography (RP-HPLC), High-performance thin-layer chromatography (HPTLC), and Ultra performance liquid chromatography (UPLC) are used for the determination of hydrochlorothiazide in combination with ACE inhibitors.
2.1. High Performance Liquid Chromatography
The primary objective in liquid chromatography method development is to achieve adequate resolution within a reasonable analysis time. This goal can be attained by systematically optimizing chromatography parameters to produce the desired outcomes. Effective chromatographic separation requires carefully balanced capacity factors—values that are neither too low (indicating a preference for the mobile phase over the stationary phase) nor too high (resulting in prolonged analysis times and reduced detection sensitivity).
Typically, method development emphasizes optimizing the mobile phase composition, specifically the ratio of water to organic solvents (modifiers). However, adjusting the pH of the mobile phase can significantly enhance selectivity. The pH influences the degree of ionization of analytes, mobile phase additives, and the stationary phase, which collectively affect the separation process. Achieving optimal selectivity often requires simultaneous adjustments to both the pH and the aqueous-to-organic solvent ratio.
The selection of a suitable method depends on several factors, including the chemical nature of the analyte, the complexity of the sample matrix, and the specific objectives of the analysis. The methods reported the determination of ACE inhibitors combinations with HCT are given in
Table 3.
Several HPLC methods have been described for the determination of ENA/HCT
| [18] | Eid, M., El‐Shabrawy, Y., & El-Shaheny, R. (2017). Green micellar HPLC analysis of three angiotensin-converting enzyme inhibitors in their mixtures with hydrochlorothiazide and modeling of their retention behavior by fitting to Foley's model. Journal of Separation Science, 40(18), 3646-3654. https://doi.org/10.1002/jssc.201700622 |
| [19] | Hammouda, M. E., Abu El-Enin, M. A., El-Sherbiny, D. T., El-Wasseef, D. R., & El-Ashry, S. M. (2015). Simultaneous determination of enalapril and hydrochlorothiazide in pharmaceutical preparations using microemulsion liquid chromatography. Journal of chromatographic science, 53(1), 90-96. https://doi.org/10.1093/chromsci/bmu024 |
| [20] | Uslu, B., & Özden, T. (2013). HPLC and UPLC methods for the simultaneous determination of enalapril and hydrochlorothiazide in pharmaceutical dosage forms. Chromatographia, 76, 1487-1494. https://doi.org/10.1007/s10337-013-2442-6 |
| [21] | de Diego, M., Mennickent, S., Godoy, G., & Miranda, V. (2011). A validated stability-indicating LC method for simultaneous determination of enalapril and hydrochlorothiazide in pharmaceutical samples. Current Pharmaceutical Analysis, 7(4), 248-252. https://doi.org/10.2174/157341211797458005 |
| [22] | Carlucci, G., Di Giuseppe, E., & Mazzeo, P. (1993). Simultaneous determination of enalapril maleate and hydrochlorothiazide in tablets by derivative UV spectrophotometry and high-performance liquid chromatography. International journal of pharmaceutics, 93(1-3), 245-248. https://doi.org/10.1016/0378-5173(93)90184-h |
| [23] | Al-Momani, I. F. (2001). Determination of hydrochlorothiazide and enalapril maleate in tablet formulations by reversed-phase HPLC. Turkish Journal of Chemistry, 25(1), 49-54. |
[18-23]
. In terms of sensitivity, the method reported by AL-Momani
| [23] | Al-Momani, I. F. (2001). Determination of hydrochlorothiazide and enalapril maleate in tablet formulations by reversed-phase HPLC. Turkish Journal of Chemistry, 25(1), 49-54. |
[23]
stands out, achieving the lowest LODs for both ENA (0.024 µg/mL) and HCT (0.036 µg/mL). This method is particularly suited for detecting trace levels of these analytes, offering a significant advantage for low-concentration applications. Carlucci et al.
| [22] | Carlucci, G., Di Giuseppe, E., & Mazzeo, P. (1993). Simultaneous determination of enalapril maleate and hydrochlorothiazide in tablets by derivative UV spectrophotometry and high-performance liquid chromatography. International journal of pharmaceutics, 93(1-3), 245-248. https://doi.org/10.1016/0378-5173(93)90184-h |
[22]
also reported excellent sensitivity with LODs of 0.1 µg/mL for ENA and 0.05 µg/mL for HCT, making it a highly sensitive isocratic reversed-phase HPLC method. Conversely, the methods described by Uslu et al.
| [20] | Uslu, B., & Özden, T. (2013). HPLC and UPLC methods for the simultaneous determination of enalapril and hydrochlorothiazide in pharmaceutical dosage forms. Chromatographia, 76, 1487-1494. https://doi.org/10.1007/s10337-013-2442-6 |
[20]
, especially the UPLC approach, showed higher LODs (2.804 µg/mL for ENA and 2.943 µg/mL for HCT), indicating relatively lower sensitivity.
Table 3. High performance liquid chromatographic methods used for the analysis of hydrochlorothiazide and ACE inhibitors combinations.
No. | ACE Inhibitor | Column | Mobile Phase | Detection λ (nm) | Working range (µg/mL) | LOD (µg/mL) | Ref |
1 | Enalapril Benazepril Lisinopril in tablets | C18 (150 x 4.6 mm, 5 µm) | sodium dodecyl sulfate (0.12 M), 1-propyl alcohol (10% v/v), triethylamine (0.3% v/v) and H3PO4 (0.02 M) at pH 3.6. The flow rate was 1.5 mL/min | 210 | 10.0-60.0 (ENA, BEN and LIS) 5.0-50.0 HCT | 1.09 ENA 0.62 BEN 0.39 LIS 1.15 HCT | | [18] | Eid, M., El‐Shabrawy, Y., & El-Shaheny, R. (2017). Green micellar HPLC analysis of three angiotensin-converting enzyme inhibitors in their mixtures with hydrochlorothiazide and modeling of their retention behavior by fitting to Foley's model. Journal of Separation Science, 40(18), 3646-3654. https://doi.org/10.1002/jssc.201700622 |
[18] |
2 | Enalapril in tablets | CN (150 x 4.6 mm, 5 µm) | 0.2 M sodium dodecyl sulfate, 1% octanol, 10% n-propanol and 0.3% triethylamine in 0.02 M phosphoric acid, and pH was adjusted at 3.5. The flow rate was 1.0 mL/min | 210 | 1-100 ENA 0.05-5 HCT | 0.33 ENA 0.05 HCT | | [19] | Hammouda, M. E., Abu El-Enin, M. A., El-Sherbiny, D. T., El-Wasseef, D. R., & El-Ashry, S. M. (2015). Simultaneous determination of enalapril and hydrochlorothiazide in pharmaceutical preparations using microemulsion liquid chromatography. Journal of chromatographic science, 53(1), 90-96. https://doi.org/10.1093/chromsci/bmu024 |
[19] |
3 | Enalapril in tablets | C18 (300 x 3.9 mm, 10 µm), 60 °C *C18 (100 x 2.1 mm, 1.7 µm), 60°C | Solvent A: phosphoric acid pH 2.5 Solvent B: acetonitrile 0 min → 5 (%B) 2 min →20 (%B) 4 min →60 (%B) 5 min →60 (%B) 6 min → 5 (%B) The flow rate was 2.0 mL/min Solvent A: phosphoric acid pH 2.5 Solvent B: acetonitrile 0 min → 5 (%B) 1.4 min → 45 (%B) 1.7 min → 95 (%B) 2.2 min → 5 (%B) 3 min → 5 (%B) The flow rate was 0.5 mL/min | 210 210 | 0.270–399 ENA 0.260-399 HCT 0.207–399 ENA 0.065–249 HCT | 1.848 ENA 31.477 HCT 2.804 ENA 2.943 HCT | | [20] | Uslu, B., & Özden, T. (2013). HPLC and UPLC methods for the simultaneous determination of enalapril and hydrochlorothiazide in pharmaceutical dosage forms. Chromatographia, 76, 1487-1494. https://doi.org/10.1007/s10337-013-2442-6 |
[20] |
4 | Enalapril in tablets | C18 (250 x 4.6 mm, 10 µm) | methanol - tetrahydrofuran - phosphate buffer (pH 2.2; 0.01M) (32:5:63, v/v/v), at a flow rate of 1.0 mL/min | 210 | 40-140 ENA 100-350 HCT | NA | | [21] | de Diego, M., Mennickent, S., Godoy, G., & Miranda, V. (2011). A validated stability-indicating LC method for simultaneous determination of enalapril and hydrochlorothiazide in pharmaceutical samples. Current Pharmaceutical Analysis, 7(4), 248-252. https://doi.org/10.2174/157341211797458005 |
[21] |
5 | Enalapril in tablets | C18 (250 x 4.6 mm, 10 µm) | 0.02 M phosphate buffer (pH 3.0): acetonitrile (50: 50 v/v). The flow rate was at 0.7 mL/ min | 220 | 0.5-30 for both | 0.1 ENA 0.05 HCT | | [22] | Carlucci, G., Di Giuseppe, E., & Mazzeo, P. (1993). Simultaneous determination of enalapril maleate and hydrochlorothiazide in tablets by derivative UV spectrophotometry and high-performance liquid chromatography. International journal of pharmaceutics, 93(1-3), 245-248. https://doi.org/10.1016/0378-5173(93)90184-h |
[22] |
6 | Enalapril in tablets | C8 (150 x. 4.0 mm ,5 µm), theophylline internal standard | 3.0 mM tetrabutyl ammonium hydrogen sulfate in acetonitrile:water:triethylamine, (14: 85.6: 6.4 v/v) adjusted to pH 4.1 by glacial acetic acid, at a flow rate of 2.0 mL/min | 220 | 100-600 ENA 80-540 HCT | 0.024 ENA 0.036 HCT | | [23] | Al-Momani, I. F. (2001). Determination of hydrochlorothiazide and enalapril maleate in tablet formulations by reversed-phase HPLC. Turkish Journal of Chemistry, 25(1), 49-54. |
[23] |
7 | Ramipril in tablets | C8 (150 x 4.6 mm, 5 µm), Clobazam internal standard | acetonitrile: sodium perchlorate solution (0.1 M) adjusted to pH 2.5 with phosphoric acid (46:54 v/v). The flow rate was 1.5 mL/min | 210 | 4.5-45 RAM 0.6-14 HCT | 0.18 RAM 0.023 HCT | | [24] | Belal, F., Al-Zaagi, I. A., Gadkariem, E. A., & Abounassif, M. A. (2001). A stability-indicating LC method for the simultaneous determination of ramipril and hydrochlorothiazide in dosage forms. Journal of pharmaceutical and biomedical analysis, 24(3), 335-342. https://doi.org/10.1016/s0731-7085(00)00474-x |
[24] |
8 | Ramipril in tablets | C18 (150 x. 4.0 mm ,5 µm) | acetonitrile and 0.1M sodium perchlorate (pH 2.5) buffer in the ratio of 3:2, at a flow rate of 1.0 mL/min | 316 HCT 210 RAM | 17.5-32.5 RAM 87.5-162.5 HCT | 0.1 RAM O.04 HCT | | [25] | Nagavi, J. B., & Anantharaju, P. G. (2014). Analytical RP-HPLC method development and validation for the simultaneous estimation of ramipril and hydrochlorothiazide in tablet dosage form. American Journal of Pharm Tech Research, 4(4), 349-365. |
[25] |
| Ramipril in tablets | C18 (150 x. 4.0 mm ,5 µm), Paracetamol internal standard | methanol: water in ratio of 90:10, at a flow rate 1.3ml/min | 214 | 2-14 for both | NA | | [26] | Garg, G., Saraf, S., & Saraf, S. (2007). Spectrophotometric and HPLC method for simultaneous estimation of Ramipril and Hydrochlorthiazide from combined dosage form. Analytical Chem, 6(2), 254-256. |
[26] |
9 | Benazepril Fosinopril Ramipril in tablets | C8 (125 x. 4.0 mm ,5 µm) | 20 mM sodium heptanesulphonote (pH 2.5): methanol (32:68 v/v). The flow rate was at 1.0 mL/ min | 220 | 1-100 BEN 1-50 FOS 5-200 RAM 0.5-50 HCT | 0.1 RAM and BEN 0.4 FOS 0.05 HCT | | [27] | Manna, L., Valvo, L., & Alimonti, S. (2001). A liquid chromatographic lon-pairing method for simultaneous determination of benazepril hydrochloride, fosinopril sodium, ramipril and hydrochlorothiazide in pharmaceutical formulations. Chromatographia, 53, S271-S275. https://doi.org/10.1007/bf02490341 |
[27] |
10 | Lisinopril in tablets | C18 (150 x 4.6 mm, 3 µm) | methanol, acetonitrile and phosphate buffer (pH 7.1; 0.05 M) (15:15:70, v/v/v) as mobile phase at a flow rate of 0.8 mL/ min | 210 | 40–200 LIS 25–175 HCT | 0.44 LIS 0.45 HCT | | [28] | de Diego, M., Soto, J., & Mennickent, S. (2014). Stability-indicating LC method for the simultaneous determination of lisinopril and hydrochlorothiazide. Journal of Chromatographic Science, 52(10), 1193-1197. https://doi.org/10.1093/chromsci/bmt176 |
[28] |
11 | Lisinopril in tablets | C18 (200 x 4.6 mm, 5 µm) | acetonitrile: water (20:80 v/v) (pH 3.8), at flow rate of 1.0 mL/min | 213 | 1.5 - 56.0 LIS 1.0-40.0 HCT | NA | | [29] | Erk, N., & Kartal, M. (1999). Comparison of high-performance liquid chromatography and absorbance ratio methods for the determination of hydrochlorothiazide and lisinopril in pharmaceutical formulations. Analytical Letters, 32(6), 1131-1141. https://doi.org/10.1080/00032719908542883 |
[29] |
12 | Lisinopril in tablets | C18 (4.6 mm × 20 mm, 3.5 µm) | 7:93 (v/v) acetonitrile:25 mM KH2PO4, pH 5(A), and 50:50 (v/v) acetonitrile:25 mM KH2PO4 pH 5 (B). 0-8 min → 100% (A) 8- 15 min → 100% (B) 15-20 min→ 100% (A) The flow rate was 1.0 mL/min | 215 | 80-1000 LIS 100-1250 HCT | 0.005 for both | | [30] | Ivanovic, D., Medenica, M., Jancic, B., Knezevic, N., Malenovic, A., & Milic, J. (2007). Validation of an analytical procedure for simultaneous determination of hydrochlorothiazide, lisinopril, and their impurities. Acta chromatographica, 18, 143-156. |
[30] |
| Lisinopril in tablets | C18 (250 x 4.6 mm, 10 µm), 40 ⁰C | KH2PO4:acetonitrile (30:70 v/v adjust pH 3.4 with orthophosphoric acid).The flow rate was 1.5 mL/ min | 215 | 50-400 LIS 25-250 HCT | 0.02 LIS 0.1 HCT | | [31] | Maslarska, V., Peikova, L., & Tsvetkova, B. (2013). RP-HPLC method for the simultaneous determination of lisinopril and hydrochlorothiazide in pharmaceutical formulation. Int J Pharm Sci Rev Res, 22, 253-256. |
[31] |
13 | Fosinopril in tablets | C18 (250 x 4.6 mm, 10 µm) Benazepril internal standard (IS) | solvent A: aqueous 10mM o-phosphoric acid solvent B: acetonitrile 0 - 4 min → 60 (%A), at flow rate of 1.0 mL/min 4 - 10 min → 20 (%A), at flow rate of 2.0 mL/min | 215 | 5.0-50.0 FOS 2.5 -25 HCT | NA | | [32] | Saglik, S., Sagirli, O., Atmaca, S., & Ersoy, L. (2001). Simultaneous determination of fosinopril and hydrochlorothiazide in tablets by derivative spectrophotometric and high-performance liquid chromatographic methods. Analytica chimica acta, 427(2), 253-257. https://doi.org/10.1016/s0003-2670(00)01201-0 |
[32] |
14 | Fosinopril in tablets | C18 (250 x 4.6 mm, 10 µm) | 0.05 M KH2PO4 (pH 3) (A), acetonitrile (B), and methanol (C). 0-6.5→ (A) 80: (B) 15: (C) 5, flow rate of 1.0 mL/min 6.5-7→(A) 25: (B) 70: (C) 5, flow rate of 1.5 mL/min 7-12 → (A) 25: (B) 70: (C) 5, flow rate of 1.5 mL/min 12-12.5→(A) 25: (B) 70: (C) 5, flow rate of 2 mL/min 12.5-13→ (A) 25: (B) 70: (C) 5, flow rate of 2 mL/min 13-13.5→ (A) 80: (B) 15: (C) 5, flow rate of 1 mL/min 13.5-15→ ( (A) 80: (B) 15: (C) 5, flow rate of 1 mL/min | 205 FOS 225 HCT | 10-100 FOS 1-30 HCT | 3.16 FOS 0.29 HCT | | [33] | Al-Sanea, M. M., Abdelgawad, M. A., Alharbi, K. S., Adly, S. M., Abdelwahab, N. S., Ali, N. W., & Abdelrahman, M. M. (2021). Simultaneous analysis of several antihypertensive drugs in different combinations: Application for determination of drug degradation products and process impurities. Microchemical Journal, 166, 106203. https://doi.org/10.1016/j.microc.2021.106203 |
[33] |
15 | Fosinopril in tablets | C 18 (300 x 3.9 mm, 10 µm) | methanol: water (40:60, v/v), adjusted to pH 4 with 10% orthophosphoric acid, flow rate of 1 mL/min | 245 | 1.6-30 FOS 1-30 HCT | 0.29 FOS 0.26 HCT | | [34] | Özkan, S. A., Akay, C., Cevheroglu, Ş., & Şentürk, Z. (2001). Rapid and accurate simultaneous determination of fosinopril sodium and hydrochlorothiazide in tablets by HPLC. Journal of liquid chromatography & related technologies, 24(7), 983-991. https://doi.org/10.1081/jlc-100103424 |
[34] |
16 | Benazepril in tablets | C18 (250 x 4.6 mm, 10 µm) | methanol: acetonitrile: water: acetic acid (40: 30:30: 0.5 v/v). Flow rate: 1.5 mL/ min. | 240 | 32-448 BEN 40-560 HCT | 0.35 BEN 0.7 HCT | | [35] | Hassib, S. T., El-Sherif, Z. A., El-Bagary, R. I., & Youssef, N. F. (2000). Reversed-phase high performance liquid chromatographic and thin layer chromatographic methods for the simultaneous determination of benazepril hydrochloride and hydrochlorothiazide in Cibadrex tablets. Analytical Letters, 33(15), 3225-3237. |
[35] |
17 | Zofenopril in tablets | C18 (250 x 4.6 mm, 10 µm), 8-Chlor- otheophylline internal standard (IS) | (A) water–TFA (99.9:0.1 v/v) and (B) acetonitrile–TFA (99.1:0.1 v/v) 0-4 min 70:30 (A: B v/v); 4-8 min 30:70 (A: B v/v); 8-15 min 30:70 (A: B v/v), delivered at a flow-rate of 1.0 mL/min | 224 HCT 245 ZOF 275 IS | 5.0-40 ZOF 1.0-20 HCT | 0.026 ZOF 0.019 HCT | | [36] | Carlucci, G., Di Federico, L., & Iuliani, P. (2010). HPLC‐DAD method for the simultaneous determination of zofenopril and hydrochlorothiazide in oral pharmaceutical formulations. Journal of Separation Science, 33(12), 1717-1722. https://doi.org/10.1080/00032719.2000.10399497 |
[36] |
18 | Quinapril in tablets | C18 (250 x 4.6 mm, 10 µm), | acetonitrile: potassium dihydrogen phosphate (at pH 2.5; 0.067 M) (40:60 v/v), delivered at a flow-rate of 1.0 mL/min | 211 | 2-30 QUI 1.25-18.75 HCT | 0.0195 QUI 0.0030 HCT | | [37] | Altunsoy, S., Bozal-palabiyik, B., & Uslu, B. (2013). Validation of liquid chromatographic method for simultaneous determination of quinapril and hydrochlorothiazide in pharmaceutical dosage forms. Turkish Journal of Pharmaceutical Sciences, 10(2), 255-262. |
[37] |
| Quinapril in tablets | C18 (150 x 4.6 mm, 5 µm), | tri ethylamine buffer, acetonitrile in proportion of 60:40 v/v, at a flow rate of 1.0 ml/min | 220 | 50-150 for both | 0.172 QUI 0.524 HCT | | [38] | Manjusha, N. (2013). A new RP-HPLC method for simultaneous estimation of quinapril and hydrochlorothiazide in pharmaceutical dosage forms. World Journal of Pharmacy and Pharmaceutical Sciences, 2(6), 6220-6234. |
[38] |
| Quinapril in tablets | C18 (125 x 4.6 mm, 5 µm) | The mobile phase consisted of acetonitrile (A) and phosphate buffer (pH 4.6; 0.01M) (B) in a gradient mode 0 min→16% A 10 min→16% A 13 min→65% A 21 min→16% A. The flow rate was set to 1 mL min | 216 | 40-200 QUI 25-125 HCT | 0.35 QUI 0.61 HCT | | [39] | de Diego, M., Mennickent, S., Muñoz, J., Sanhueza, F., & Godoy, R. (2014). A validated stability-indicating LC method for simultaneous determination of quinapril and hydrochlorothiazide in pharmaceutical samples. Open Chemistry, 12(4), 470-475. https://doi.org/10.2478/s11532-013-0396-z |
[39] |
| Quinapril in tablets | C18 (250 x 4.6 mm, 5 µm) | methanol and phosphate buffer (pH-3.8) (40:60% v/v) at a flow rate of 1.0 mL/min | 225 | 10-30 QUI 30-90 HCT | NA | | [40] | Pravallika, G., Sudhakar, B., Chaitanya, P., Sravan K. (2024). Development and validation of RP-HPLC method for the simultaneous estimation of quinapril and hydrochlorothiazide in API form and pharmaceutical dosage form. Int. J. of Pharmacy and Analytical Research, 13(4):518-527. |
[40] |
| Quinapril in tablets | C18 (150 x 4.6 mm, 5 µm), | 0.1% v/v triethylamine (pH 3.5), containing 1 mM of hexane sulphonic acid: acetonitrile (30:70% v/v). The flow rate was set to 1 mL min | 220 | 30-150 QUI 40-200 HCT | 0.05 QUI 0.02 HCT | | [41] | Gandhimathi, M., & Ravi, T. K. (2009). Ion pair-HPLC method for the simultaneous estimation of quinapril and hydrochlorothiazide in tablets. Indian Journal of Pharmaceutical Sciences, 71(3), 311. https://doi.org/10.4103/0250-474x.56035 |
[41] |
19 | Captopril in tablets | C18 (150 x 4.6 mm, 5 µm), 40 °C, phenobarbital internal standard | methanol/water (45:55 v/v). The pH of the mobile phase was adjusted to 3.8 with 85% ortophosphoric acid. The flow rate was 1.0 mL/min | 210 | 20-200 CAP 10-100 HCT | 5 CAP 2 HCT | | [42] | Ivanovic, D., Medenica, M., Malenovic, A., & Jancic, B. (2004). Validation of the RP–HPLC method for analysis of hydrochlorothiazide and captopril in tablets. Accreditation and Quality Assurance, 9, 76-81. https://doi.org/10.1007/s00769-003-0722-9 |
[42] |
The method by Hammouda et al.
| [19] | Hammouda, M. E., Abu El-Enin, M. A., El-Sherbiny, D. T., El-Wasseef, D. R., & El-Ashry, S. M. (2015). Simultaneous determination of enalapril and hydrochlorothiazide in pharmaceutical preparations using microemulsion liquid chromatography. Journal of chromatographic science, 53(1), 90-96. https://doi.org/10.1093/chromsci/bmu024 |
[19]
demonstrates a broad linear range for ENA (1–100 µg/mL) and HCT (5.0–50.0 µg/mL) while maintaining low LODs (0.33 µg/mL for ENA and 0.05 µg/mL for HCT). This combination of sensitivity and range makes it highly practical for diverse analytical applications. AL-Momani
| [23] | Al-Momani, I. F. (2001). Determination of hydrochlorothiazide and enalapril maleate in tablet formulations by reversed-phase HPLC. Turkish Journal of Chemistry, 25(1), 49-54. |
[23]
, despite its exceptional sensitivity, has a much higher linear range (100–600 µg/mL for ENA and 80–540 µg/mL for HCT), which might limit its use for lower concentrations in routine analysis.
The methods by Eid et al.
| [18] | Eid, M., El‐Shabrawy, Y., & El-Shaheny, R. (2017). Green micellar HPLC analysis of three angiotensin-converting enzyme inhibitors in their mixtures with hydrochlorothiazide and modeling of their retention behavior by fitting to Foley's model. Journal of Separation Science, 40(18), 3646-3654. https://doi.org/10.1002/jssc.201700622 |
[18]
and Carlucci et al.
| [22] | Carlucci, G., Di Giuseppe, E., & Mazzeo, P. (1993). Simultaneous determination of enalapril maleate and hydrochlorothiazide in tablets by derivative UV spectrophotometry and high-performance liquid chromatography. International journal of pharmaceutics, 93(1-3), 245-248. https://doi.org/10.1016/0378-5173(93)90184-h |
[22]
are isocratic, making them simpler and more reproducible, ideal for routine quality control. However, the narrow linear range reported by Carlucci et al. (0.5–30 µg/mL for both ENA and HCT) might limit its application in cases where higher concentrations need to be analyzed. In contrast, de Diego et al.
| [21] | de Diego, M., Mennickent, S., Godoy, G., & Miranda, V. (2011). A validated stability-indicating LC method for simultaneous determination of enalapril and hydrochlorothiazide in pharmaceutical samples. Current Pharmaceutical Analysis, 7(4), 248-252. https://doi.org/10.2174/157341211797458005 |
[21]
offers a wide linear range (40–140 µg/mL for ENA and 100–350 µg/mL for HCT) but does not report LOD values, making it difficult to assess sensitivity.
Gradient methods, such as those by Uslu et al.
| [20] | Uslu, B., & Özden, T. (2013). HPLC and UPLC methods for the simultaneous determination of enalapril and hydrochlorothiazide in pharmaceutical dosage forms. Chromatographia, 76, 1487-1494. https://doi.org/10.1007/s10337-013-2442-6 |
[20]
, provide the advantage of handling a wide range of analyte concentrations (0.207–399 µg/mL for ENA and 0.065–249 µg/mL for HCT in UPLC), but the higher complexity and elevated column temperature (60°C) may limit their practicality for routine labs that prioritize simplicity.
For applications requiring high sensitivity, AL-Momani
| [23] | Al-Momani, I. F. (2001). Determination of hydrochlorothiazide and enalapril maleate in tablet formulations by reversed-phase HPLC. Turkish Journal of Chemistry, 25(1), 49-54. |
[23]
and Carlucci et al.
| [22] | Carlucci, G., Di Giuseppe, E., & Mazzeo, P. (1993). Simultaneous determination of enalapril maleate and hydrochlorothiazide in tablets by derivative UV spectrophotometry and high-performance liquid chromatography. International journal of pharmaceutics, 93(1-3), 245-248. https://doi.org/10.1016/0378-5173(93)90184-h |
[22]
are the most suitable. However, for a balance of sensitivity, practicality, and versatility, Hammouda et al.
| [19] | Hammouda, M. E., Abu El-Enin, M. A., El-Sherbiny, D. T., El-Wasseef, D. R., & El-Ashry, S. M. (2015). Simultaneous determination of enalapril and hydrochlorothiazide in pharmaceutical preparations using microemulsion liquid chromatography. Journal of chromatographic science, 53(1), 90-96. https://doi.org/10.1093/chromsci/bmu024 |
[19]
provides a robust method with a wide linear range and low LODs, making it highly practical for routine analysis. Methods by Eid et al.
| [18] | Eid, M., El‐Shabrawy, Y., & El-Shaheny, R. (2017). Green micellar HPLC analysis of three angiotensin-converting enzyme inhibitors in their mixtures with hydrochlorothiazide and modeling of their retention behavior by fitting to Foley's model. Journal of Separation Science, 40(18), 3646-3654. https://doi.org/10.1002/jssc.201700622 |
[18]
and De Diego et al.
| [21] | de Diego, M., Mennickent, S., Godoy, G., & Miranda, V. (2011). A validated stability-indicating LC method for simultaneous determination of enalapril and hydrochlorothiazide in pharmaceutical samples. Current Pharmaceutical Analysis, 7(4), 248-252. https://doi.org/10.2174/157341211797458005 |
[21]
are practical for specific concentration ranges, while Uslu et al.
| [20] | Uslu, B., & Özden, T. (2013). HPLC and UPLC methods for the simultaneous determination of enalapril and hydrochlorothiazide in pharmaceutical dosage forms. Chromatographia, 76, 1487-1494. https://doi.org/10.1007/s10337-013-2442-6 |
[20]
offers flexibility but at the cost of increased complexity.
Comparing the methods reported for the determination of RAM and HCT, the sensitivity of the methods; determined by the limit of detection (LOD) and linear range, varies for both drugs. The methods by Belal et al.
| [24] | Belal, F., Al-Zaagi, I. A., Gadkariem, E. A., & Abounassif, M. A. (2001). A stability-indicating LC method for the simultaneous determination of ramipril and hydrochlorothiazide in dosage forms. Journal of pharmaceutical and biomedical analysis, 24(3), 335-342. https://doi.org/10.1016/s0731-7085(00)00474-x |
[24]
and Nagavi et al.
| [25] | Nagavi, J. B., & Anantharaju, P. G. (2014). Analytical RP-HPLC method development and validation for the simultaneous estimation of ramipril and hydrochlorothiazide in tablet dosage form. American Journal of Pharm Tech Research, 4(4), 349-365. |
[25]
show relatively high sensitivity for HCT, with LOD values of 0.023 µg/mL and 0.04 µg/mL, respectively, while for ramipril, their LODs are 0.18 µg/mL and 0.1 µg/mL. In contrast, Manna et al.’s method
| [27] | Manna, L., Valvo, L., & Alimonti, S. (2001). A liquid chromatographic lon-pairing method for simultaneous determination of benazepril hydrochloride, fosinopril sodium, ramipril and hydrochlorothiazide in pharmaceutical formulations. Chromatographia, 53, S271-S275. https://doi.org/10.1007/bf02490341 |
[27]
achieves an LOD of 0.1 µg/mL for ramipril and 0.05 µg/mL for HCT, making it highly sensitive for both drugs. The sensitivity of Garg et al.’s method cannot be fully assessed due to the absence of reported LOD values.
Considering the linear range, Manna et al.’s method again offers the broadest range for both drugs, covering 5–200 µg/mL for ramipril and 0.5–50 µg/mL for HCT, making it applicable across a wide spectrum of concentrations. Belal et al.’s method provides a moderate range of 4.5–45 µg/mL for ramipril and 0.6–14 µg/mL for HCT, making it suitable for routine pharmaceutical quality control applications. Nagavi et al.’s method covers a relatively narrow range for both analytes (17.5–32.5 µg/mL for ramipril and 87.5–162.5 µg/mL for HCT), which could limit its applicability to specific formulation strengths. Garg et al.’s method
| [26] | Garg, G., Saraf, S., & Saraf, S. (2007). Spectrophotometric and HPLC method for simultaneous estimation of Ramipril and Hydrochlorthiazide from combined dosage form. Analytical Chem, 6(2), 254-256. |
[26]
offers the narrowest range (2–14 µg/mL), primarily suitable for low-dose formulations.
In terms of practicality, methods with lower flow rates, such as those of Nagavi et al. and Manna et al. (1.0 mL/min), are more cost-effective due to reduced solvent consumption and extended column life. Belal et al.’s method, operating at a higher flow rate of 1.5 mL/min, may incur higher operational costs due to increased solvent usage. The mobile phase compositions also impact practicality; for example, Garg et al.’s use of a methanol-rich mobile phase (90:10 methanol: water) could lead to higher solvent expenses and potential stability issues during prolonged use.
In conclusion, Manna et al.’s method emerges as the most versatile, offering the lowest LOD values for ramipril and HCT while covering a broad linear range, making it ideal for diverse pharmaceutical applications, including stability studies and routine analysis. Belal et al.’s method provides a good balance between sensitivity and practicality, while Nagavi et al.’s method is suitable for specific concentration ranges with efficient solvent usage. Garg et al.’s method, although practical for low concentrations, lacks sufficient sensitivity data for broader applications.
The reported analytical methods for the simultaneous determination of lisinopril (LIS) and hydrochlorothiazide (HCT) exhibit differences in terms of sensitivity, linear range, and applicability, each offering distinct advantages based on the intended application.
In terms of sensitivity, the method developed by Ivanovic et al.
| [30] | Ivanovic, D., Medenica, M., Jancic, B., Knezevic, N., Malenovic, A., & Milic, J. (2007). Validation of an analytical procedure for simultaneous determination of hydrochlorothiazide, lisinopril, and their impurities. Acta chromatographica, 18, 143-156. |
[30]
stands out as the most sensitive, with an exceptionally low limit of detection (LOD) of 0.005 µg/mL for both LIS and HCT, making it highly suitable for trace-level detection in pharmaceutical formulations and biological matrices. Following this, the method by Maslarska et al.
| [31] | Maslarska, V., Peikova, L., & Tsvetkova, B. (2013). RP-HPLC method for the simultaneous determination of lisinopril and hydrochlorothiazide in pharmaceutical formulation. Int J Pharm Sci Rev Res, 22, 253-256. |
[31]
also demonstrates good sensitivity, with an LOD of 0.02 µg/mL for LIS and 0.1 µg/mL for HCT, offering reliable detection capabilities for low concentrations. In contrast, the method by de Diego et al.
| [28] | de Diego, M., Soto, J., & Mennickent, S. (2014). Stability-indicating LC method for the simultaneous determination of lisinopril and hydrochlorothiazide. Journal of Chromatographic Science, 52(10), 1193-1197. https://doi.org/10.1093/chromsci/bmt176 |
[28]
presents higher LOD values of 0.44 µg/mL for LIS and 0.45 µg/mL for HCT, indicating lower sensitivity compared to other methods, which might limit its use in trace analysis. The LOD values for the method by Erk et al.
| [29] | Erk, N., & Kartal, M. (1999). Comparison of high-performance liquid chromatography and absorbance ratio methods for the determination of hydrochlorothiazide and lisinopril in pharmaceutical formulations. Analytical Letters, 32(6), 1131-1141. https://doi.org/10.1080/00032719908542883 |
[29]
were not reported, making direct comparison difficult, though its use of a simple mobile phase suggests potential applicability in routine analysis.
When considering the linear range, the method by Ivanovic et al. provides the widest range, covering 80–1000 µg/mL for LIS and 100–1250 µg/mL for HCT, making it ideal for applications requiring a broad concentration range, such as stability studies and high-dose formulations. Maslarska et al.’s method also offers a reasonably broad range of 50–400 µg/mL for LIS and 25–250 µg/mL for HCT, supporting its use in quality control of various dosage forms. On the other hand, the methods by de Diego et al. and Erk et al. have narrower working ranges, with De Diego’s method covering 40–200 µg/mL for LIS and 25–175 µg/mL for HCT, while Erk et al.’s method focuses on lower concentrations, with a range of 1.5–56 µg/mL for LIS and 1.0–40 µg/mL for HCT, making it more suitable for low-dose formulations and biological applications.
From an applicability perspective, factors such as column type, flow rate, and mobile phase composition play a crucial role. Ivanovic et al.’s method, despite its excellent sensitivity and broad range, employs a complex gradient elution program with varying mobile phase compositions, which could pose challenges for routine analysis due to longer run times and operational complexity. Conversely, the method by Erk et al., utilizing a simple acetonitrile-water mobile phase (20:80, v/v) at pH 3.8 and a moderate flow rate of 1.0 mL/min, offers a straightforward and cost-effective approach for routine quality control with minimal solvent consumption. Maslarska et al.’s method, with a higher flow rate of 1.5 mL/min and the use of a C18 column at elevated temperature (40 °C), might offer improved resolution but could increase operational costs due to higher solvent usage. De Diego et al.’s method, with the lowest flow rate (0.8 mL/min) and a simple mobile phase composition, provides a practical solution for routine pharmaceutical applications, though its lower sensitivity may be a limitation for trace analysis.
In conclusion, the method by Ivanovic et al. offers superior sensitivity and the broadest working range, making it ideal for applications requiring high sensitivity and flexibility in concentration levels. Maslarska et al.’s method provides a balanced approach with good sensitivity and a broad range, suitable for routine pharmaceutical quality control. Erk et al.’s method is practical and cost-effective for routine applications, particularly for lower concentration samples, while de Diego et al.’s method, despite its practicality, may be less suitable for low-level detection due to its higher LOD values.
The comparison of analytical methods for the simultaneous determination of fosinopril (FOS) and hydrochlorothiazide (HCT) highlights significant differences in sensitivity, linear range, and applicability. Sensitivity, as reflected by the limit of detection (LOD), varies considerably across the methods. Manna et al.’s method
| [27] | Manna, L., Valvo, L., & Alimonti, S. (2001). A liquid chromatographic lon-pairing method for simultaneous determination of benazepril hydrochloride, fosinopril sodium, ramipril and hydrochlorothiazide in pharmaceutical formulations. Chromatographia, 53, S271-S275. https://doi.org/10.1007/bf02490341 |
[27]
demonstrates the highest sensitivity for HCT with an LOD of 0.05 µg/mL, and a relatively low LOD for FOS at 0.4 µg/mL, making it suitable for trace-level detection. In contrast, Özkan et al.
| [34] | Özkan, S. A., Akay, C., Cevheroglu, Ş., & Şentürk, Z. (2001). Rapid and accurate simultaneous determination of fosinopril sodium and hydrochlorothiazide in tablets by HPLC. Journal of liquid chromatography & related technologies, 24(7), 983-991. https://doi.org/10.1081/jlc-100103424 |
[34]
achieves better sensitivity for FOS with an LOD of 0.29 µg/mL, while also providing a low LOD for HCT at 0.26 µg/mL, indicating strong performance for both analytes. Al-Sanea et al.’s method
| [33] | Al-Sanea, M. M., Abdelgawad, M. A., Alharbi, K. S., Adly, S. M., Abdelwahab, N. S., Ali, N. W., & Abdelrahman, M. M. (2021). Simultaneous analysis of several antihypertensive drugs in different combinations: Application for determination of drug degradation products and process impurities. Microchemical Journal, 166, 106203. https://doi.org/10.1016/j.microc.2021.106203 |
[33]
, however, exhibits the highest LOD values, with 3.16 µg/mL for FOS and 0.29 µg/mL for HCT, which may limit its application for low-level detection. The LOD values for Saglik et al.’s method
| [32] | Saglik, S., Sagirli, O., Atmaca, S., & Ersoy, L. (2001). Simultaneous determination of fosinopril and hydrochlorothiazide in tablets by derivative spectrophotometric and high-performance liquid chromatographic methods. Analytica chimica acta, 427(2), 253-257. https://doi.org/10.1016/s0003-2670(00)01201-0 |
[32]
were not reported, making it difficult to assess its sensitivity directly.
In terms of linear range, the methods exhibit notable differences in their applicability to various concentration levels. Al-Sanea et al.’s method covers the broadest range for FOS (10–100 µg/mL) and HCT (1–30 µg/mL), making it suitable for applications requiring analysis of high drug concentrations. Manna et al.’s method also provides a relatively broad range of 1–50 µg/mL for FOS and 0.5–50 µg/mL for HCT, offering a good balance between sensitivity and versatility. Özkan et al. and Saglik et al. report narrower ranges of 1.6–30 µg/mL and 5.0–50 µg/mL for FOS, respectively, with HCT ranges of 1–30 µg/mL and 2.5–25 µg/mL, which may be appropriate for routine quality control but less ideal for samples with higher variability in concentration.
When considering applicability, several factors, such as column type, mobile phase composition, and flow rate, influence the practicality of each method. Manna et al.’s method, utilizing a shorter C8 column (125 x 4.0 mm, 5 µm) and a straightforward mobile phase of sodium heptanesulfonate in methanol, provides a simple and efficient option with a constant flow rate of 1.0 mL/min, making it highly practical for routine pharmaceutical analysis. In contrast, Al-Sanea et al. and Saglik et al. employ complex gradient elution programs with varying flow rates, which, while effective for separation, may pose challenges in routine use due to increased operational complexity and longer run times. Özkan et al. offers a relatively simple isocratic method using a methanol-water mixture, with a flow rate of 1.0 mL/min, making it practical and cost-effective for routine laboratory use.
In conclusion, Manna et al.’s method stands out for its high sensitivity, broad linear range, and simplicity, making it well-suited for routine analysis and trace-level detection. Özkan et al.’s method provides a good balance between sensitivity and practicality, while Al-Sanea et al.’s method, with its broad range, is more appropriate for high-concentration applications despite its higher LOD. Saglik et al.’s method, though applicable to moderate concentration levels, lacks sufficient sensitivity data for a thorough assessment of its performance in trace analysis.
The HPLC methods developed by Manna et al.
| [27] | Manna, L., Valvo, L., & Alimonti, S. (2001). A liquid chromatographic lon-pairing method for simultaneous determination of benazepril hydrochloride, fosinopril sodium, ramipril and hydrochlorothiazide in pharmaceutical formulations. Chromatographia, 53, S271-S275. https://doi.org/10.1007/bf02490341 |
[27]
and Hassib et al.
| [35] | Hassib, S. T., El-Sherif, Z. A., El-Bagary, R. I., & Youssef, N. F. (2000). Reversed-phase high performance liquid chromatographic and thin layer chromatographic methods for the simultaneous determination of benazepril hydrochloride and hydrochlorothiazide in Cibadrex tablets. Analytical Letters, 33(15), 3225-3237. |
[35]
for the simultaneous determination of benazepril (BEN) and hydrochlorothiazide (HCT) combination; differ in terms of sensitivity, linearity, and operational approach, offering distinct advantages depending on analytical requirements. Manna et al. utilized an ion-pair reversed-phase HPLC method with isocratic elution, achieving notably low limits of detection (LOD) of 0.1 µg/mL for BEN and 0.05 µg/mL for HCT. Their method provides a broad linear range of 1-100 µg/mL for BEN and 0.5-50 µg/mL for HCT, making it highly sensitive and suitable for low-concentration analyses in routine quality control. In contrast, Hassib et al. employed a conventional reversed-phase HPLC method, also with isocratic elution, but reported higher LOD values of 0.35 µg/mL for BEN and 0.7 µg/mL for HCT. Their method covers a significantly higher concentration range, with linearity extending from 32-448 µg/mL for BEN and 40-560 µg/mL for HCT, suggesting its applicability in formulations where higher analyte concentrations are expected. However, the relatively higher LOD values indicate that this method may be less suitable for trace-level detection compared to the approach by Manna et al.
Overall, the method by Manna et al. offers superior sensitivity and a wider dynamic range at lower concentrations, making it ideal for applications requiring precise quantification of low analyte levels. On the other hand, Hassib et al.'s method, with its extended linear range, is better suited for high-dose formulations or bulk analysis, despite being less sensitive. The choice between these methods ultimately depends on the analytical objectives, with Manna et al.'s method excelling in sensitivity and Hassib et al.'s method providing a robust solution for higher concentration samples.
The analytical methods reported for the determination of quinapril (QUI) and hydrochlorothiazide (HCT) combination vary in sensitivity, linear range, and applicability, each addressing different analytical requirements.
In terms of sensitivity, the method developed by Altunsoy et al.
| [37] | Altunsoy, S., Bozal-palabiyik, B., & Uslu, B. (2013). Validation of liquid chromatographic method for simultaneous determination of quinapril and hydrochlorothiazide in pharmaceutical dosage forms. Turkish Journal of Pharmaceutical Sciences, 10(2), 255-262. |
[37]
exhibits the highest sensitivity, with exceptionally low limits of detection (LOD) of 0.0195 µg/mL for QUI and 0.0030 µg/mL for HCT. This makes it highly suitable for trace-level quantification in pharmaceutical products and biological samples. Gandhimathi et al.
| [41] | Gandhimathi, M., & Ravi, T. K. (2009). Ion pair-HPLC method for the simultaneous estimation of quinapril and hydrochlorothiazide in tablets. Indian Journal of Pharmaceutical Sciences, 71(3), 311. https://doi.org/10.4103/0250-474x.56035 |
[41]
also offer good sensitivity, with LOD values of 0.05 µg/mL for QUI and 0.02 µg/mL for HCT, making it appropriate for applications requiring moderate sensitivity. In contrast, the methods proposed by Manjusha et al.
| [38] | Manjusha, N. (2013). A new RP-HPLC method for simultaneous estimation of quinapril and hydrochlorothiazide in pharmaceutical dosage forms. World Journal of Pharmacy and Pharmaceutical Sciences, 2(6), 6220-6234. |
[38]
and de Diego et al.
| [39] | de Diego, M., Mennickent, S., Muñoz, J., Sanhueza, F., & Godoy, R. (2014). A validated stability-indicating LC method for simultaneous determination of quinapril and hydrochlorothiazide in pharmaceutical samples. Open Chemistry, 12(4), 470-475. https://doi.org/10.2478/s11532-013-0396-z |
[39]
report significantly higher LOD values of 0.172 µg/mL and 0.35 µg/mL for QUI, and 0.524 µg/mL and 0.61 µg/mL for HCT, respectively, suggesting that they may not be suitable for trace-level detection. Meanwhile, the sensitivity of the method by Pravallika et al.
| [40] | Pravallika, G., Sudhakar, B., Chaitanya, P., Sravan K. (2024). Development and validation of RP-HPLC method for the simultaneous estimation of quinapril and hydrochlorothiazide in API form and pharmaceutical dosage form. Int. J. of Pharmacy and Analytical Research, 13(4):518-527. |
[40]
remains unknown as the LOD values were not provided, making direct comparisons challenging.
The linear range, Diego et al.'s method covers the widest concentration range, spanning 40–200 µg/mL for QUI and 25–125 µg/mL for HCT, making it ideal for high-concentration formulations and stability studies. Similarly, Gandhimathi et al. offer a relatively broad range of 30–150 µg/mL for QUI and 40–200 µg/mL for HCT, which is advantageous for routine pharmaceutical applications. On the other hand, Altunsoy et al. provide a more limited linear range of 2–30 µg/mL for QUI and 1.25–18.75 µg/mL for HCT, making it particularly suitable for low-dose formulations and bioanalytical purposes. The method by Manjusha et al. focuses on a narrower range of 50–150 µg/mL for both analytes, potentially restricting its use to mid-level concentrations, whereas Pravallika et al. cover a range of 10–30 µg/mL for QUI and 30–90 µg/mL for HCT, making it more applicable for specific quality control purposes.
Altunsoy et al.'s approach utilizes a C18 column (250 x 4.6 mm, 10 µm) with a simple mobile phase consisting of acetonitrile and phosphate buffer at pH 2.5, offering a practical solution with excellent sensitivity and a manageable flow rate of 1.0 mL/min, making it well-suited for routine pharmaceutical analysis. Manjusha et al. and Gandhimathi et al. incorporate triethylamine in their mobile phases, which may enhance peak resolution but could limit their utility in trace-level analysis due to higher LOD values. Diego et al. employs a gradient elution technique with varying proportions of acetonitrile and phosphate buffer, ensuring excellent separation but potentially complicating routine application due to the complexity and extended run time. Pravallika et al.’s method, which uses an isocratic methanol-phosphate buffer system, offers simplicity and ease of use; however, the lack of reported sensitivity data may limit its broader application.
The method by Altunsoy et al. stands out due to its exceptional sensitivity and lower working range, making it particularly suitable for trace-level detection and quality control. Gandhimathi et al. offer a good balance between sensitivity and a wide linear range, making it an attractive choice for routine pharmaceutical analysis. Diego et al. provides a broad working range, though its complexity may hinder routine use. Meanwhile, the methods by Manjusha et al. and Pravallika et al. may serve specific purposes but are somewhat limited by their sensitivity and dynamic range for broader pharmaceutical and bioanalytical applications.
Most of the reported chromatographic methods for the determination of these ACE inhibitors in combination with HCT utilize aqueous-organic mobile phases that contain large amounts of organic solvents. This not only results in high costs but also poses significant environmental and health hazards to both the environment and the chromatographer. In contrast, Eid et al.
| [18] | Eid, M., El‐Shabrawy, Y., & El-Shaheny, R. (2017). Green micellar HPLC analysis of three angiotensin-converting enzyme inhibitors in their mixtures with hydrochlorothiazide and modeling of their retention behavior by fitting to Foley's model. Journal of Separation Science, 40(18), 3646-3654. https://doi.org/10.1002/jssc.201700622 |
[18]
and Hammouda et al.
| [19] | Hammouda, M. E., Abu El-Enin, M. A., El-Sherbiny, D. T., El-Wasseef, D. R., & El-Ashry, S. M. (2015). Simultaneous determination of enalapril and hydrochlorothiazide in pharmaceutical preparations using microemulsion liquid chromatography. Journal of chromatographic science, 53(1), 90-96. https://doi.org/10.1093/chromsci/bmu024 |
[19]
introduced HPLC methods that employ environmentally friendly, cost-effective, and safer micellar eluents. These methods utilize surfactant solutions at concentrations exceeding their critical micelle concentration (CMC), with only a minimal proportion of organic solvents, offering a greener alternative for the simultaneous quantification of these drugs in their combined formulations with HCT.
AL-Momani et al.
| [23] | Al-Momani, I. F. (2001). Determination of hydrochlorothiazide and enalapril maleate in tablet formulations by reversed-phase HPLC. Turkish Journal of Chemistry, 25(1), 49-54. |
[23]
and Manna et al.
| [27] | Manna, L., Valvo, L., & Alimonti, S. (2001). A liquid chromatographic lon-pairing method for simultaneous determination of benazepril hydrochloride, fosinopril sodium, ramipril and hydrochlorothiazide in pharmaceutical formulations. Chromatographia, 53, S271-S275. https://doi.org/10.1007/bf02490341 |
[27]
incorporated ion-pairing agents in their methods to enhance analyte retention and resolution, resulting in well-defined, symmetric peaks for ACE inhibitors. The use of ion-pairing agents effectively improved chromatographic performance by minimizing peak tailing and ensuring accurate quantification of the analytes.
Many reported methods have been confirmed as stability-indicating through the analysis of forced degradation samples
| [20] | Uslu, B., & Özden, T. (2013). HPLC and UPLC methods for the simultaneous determination of enalapril and hydrochlorothiazide in pharmaceutical dosage forms. Chromatographia, 76, 1487-1494. https://doi.org/10.1007/s10337-013-2442-6 |
| [21] | de Diego, M., Mennickent, S., Godoy, G., & Miranda, V. (2011). A validated stability-indicating LC method for simultaneous determination of enalapril and hydrochlorothiazide in pharmaceutical samples. Current Pharmaceutical Analysis, 7(4), 248-252. https://doi.org/10.2174/157341211797458005 |
| [24] | Belal, F., Al-Zaagi, I. A., Gadkariem, E. A., & Abounassif, M. A. (2001). A stability-indicating LC method for the simultaneous determination of ramipril and hydrochlorothiazide in dosage forms. Journal of pharmaceutical and biomedical analysis, 24(3), 335-342. https://doi.org/10.1016/s0731-7085(00)00474-x |
| [28] | de Diego, M., Soto, J., & Mennickent, S. (2014). Stability-indicating LC method for the simultaneous determination of lisinopril and hydrochlorothiazide. Journal of Chromatographic Science, 52(10), 1193-1197. https://doi.org/10.1093/chromsci/bmt176 |
| [33] | Al-Sanea, M. M., Abdelgawad, M. A., Alharbi, K. S., Adly, S. M., Abdelwahab, N. S., Ali, N. W., & Abdelrahman, M. M. (2021). Simultaneous analysis of several antihypertensive drugs in different combinations: Application for determination of drug degradation products and process impurities. Microchemical Journal, 166, 106203. https://doi.org/10.1016/j.microc.2021.106203 |
| [39] | de Diego, M., Mennickent, S., Muñoz, J., Sanhueza, F., & Godoy, R. (2014). A validated stability-indicating LC method for simultaneous determination of quinapril and hydrochlorothiazide in pharmaceutical samples. Open Chemistry, 12(4), 470-475. https://doi.org/10.2478/s11532-013-0396-z |
[20, 21, 24, 28, 33, 39]
. However, a significant number of these methods lack proper development and optimization, often misinterpreting preliminary adjustments of method control parameters as comprehensive optimization. Although such methods are typically validated in accordance with global guidelines, such as ICH Q2 (R1)
| [43] | International Council for Harmonisation of Technical Requirements for Pharmaceuticals for Human Use (ICH) Expert Working Group (2005). Validation of analytical procedures: text and methodology, Q2 (R1). Proceedings of the International Conference on Harmonization of Technical Requirements for Registration of Pharmaceuticals for Human Use. Chicago, IL, USA: ICH; |
[43]
, before being implemented for routine use, they frequently fail to demonstrate robustness during quality control (QC) testing, rendering them unsuitable for their intended applications. Given the stringent regulatory requirements and the growing emphasis on applying Analytical Quality by Design (AQbD) principles, it is crucial to establish more stringent publication standards for analytical methods. This approach will ensure the development of truly robust methods that are reliable and suitable for QC laboratories.
2.2. High-performance Thin Layer Chromatography (HPTLC)
The HPTLC separation of hydrochlorothiazide (HCT) in combination with ACE inhibitors is typically performed on silica gel 60F254 precoated plates under various chromatographic conditions.
Hassib et al.
| [35] | Hassib, S. T., El-Sherif, Z. A., El-Bagary, R. I., & Youssef, N. F. (2000). Reversed-phase high performance liquid chromatographic and thin layer chromatographic methods for the simultaneous determination of benazepril hydrochloride and hydrochlorothiazide in Cibadrex tablets. Analytical Letters, 33(15), 3225-3237. |
[35]
developed a separation method using a mobile phase composed of ethyl acetate, methanol, and ammonia in an 85:20:10 (v/v) ratio. The detection was carried out at 240 nm for BEN and 272 nm for HCT. The method exhibited a linear range of 0.768–9.6 µg/spot for BEN and 0.96–12 µg/spot for HCT, with limits of detection (LOD) of 0.12 µg/spot and 0.24 µg/spot, respectively.
Conversely, Naguib et al.
| [44] | Naguib IA, Abdelaleem EA, Zaazaa HE, Draz ME. (2015). Simultaneous determination of hydrochlorothiazide and benazepril hydrochloride or amiloride hydrochloride in presence of hydrochlorothiazide impurities: Chlorothiazide and salamide by HPTLC method. Journal of Chromatographic Science, 53(1), 183-8. https://doi.org/10.1093/chromsci/bmu016 |
[44]
employed a different mobile phase consisting of ethyl acetate, methanol, and glacial acetic acid in an 85:2:0.3 (v/v/v) ratio to achieve the separation of BEN and HCT. Analyte detection was performed at 240 nm, with the method demonstrating linearity within the ranges of 0.2–1.8 µg/band for HCT and 0.4–2.2 µg/band for BEN. The method provided lower LOD values of 0.041 µg/band for HCT and 0.102 µg/band for BEN, indicating enhanced sensitivity.
A comparison of the HPTLC methods developed by Hassib et al. and Naguib et al. reveals notable differences in sensitivity and practical utility. Naguib et al. adopted a single detection wavelength of 240 nm for both analytes, simplifying the detection process. In contrast, Hassib et al. optimized their method by utilizing two different wavelengths—240 nm for BEN and 272 nm for HCT—offering improved specificity for each compound.
The superior sensitivity of Naguib et al.'s method, as indicated by its lower LOD values, makes it particularly advantageous for applications involving trace-level quantification. However, Hassib et al.'s method provides a wider linear range, which enhances its suitability for routine analysis, particularly for samples with higher concentrations of analytes. Furthermore, the composition of their mobile phase contributes to greater versatility, making it adaptable to a wider variety of sample matrices.
While Naguib et al.’s approach is ideal for scenarios requiring high sensitivity, Hassib et al.’s method is more appropriate for routine, high-throughput applications covering a broader concentration range. Jyoti and Sanjay
| [45] | Jyoti, V., Sanjay, K.K. (2024). Development and validation of the HPTLC method for the simultaneous estimation of ramipril and hydrochlorothiazide in solid dosage form. International Journal of Pharmaceutical Sciences and Research, 15(2): 563-570. https://doi.org/10.13040/IJPSR.0975-8232.15(2).563-70 |
[45]
developed a method for the determination of RAM and HCT using a mobile phase consisting of methanol, toluene, ethyl acetate, and glacial acetic acid in a volumetric ratio of 1:6:3:0.5. Spot detection was performed at 210 nm, and the method was thoroughly validated for linearity, accuracy, precision, and specificity. The calibration curves demonstrated good linearity within the concentration ranges of 2000–12000 ng/spot for RAM and 500–3000 ng/spot for HCT. The method exhibited limits of detection (LOD) of 434.1 ng/spot for RAM and 80.6 ng/spot for HCT, indicating moderate sensitivity, particularly for HCT. The method provides a reliable and straightforward approach for the simultaneous quantification of RAM and HCT in pharmaceutical formulations. The relatively broad linear range allows for effective analysis across various concentration levels, making it suitable for routine quality control and dosage form analysis. However, the use of toluene in the mobile phase, known for its environmental and health-related concerns, may necessitate careful handling and adherence to safety regulations. Additionally, the relatively higher LOD for RAM suggests that the method may not be ideal for trace-level detection, potentially limiting its use in stability studies or low-dose formulations. Nonetheless, the method's validation across multiple performance parameters enhances its credibility and practical utility in well-equipped analytical laboratories.
The method developed by El Gindy et al.
| [46] | El-Gindy, A., Ashour, A., Abdel-Fattah, L., & Shabana, M. M. (2001). Spectrophotometric and HPTLC-densitometric determination of lisinopril and hydrochlorothiazide in binary mixtures. Journal of Pharmaceutical and Biomedical Analysis, 25(5-6), 923-931. https://doi.org/10.1016/s0731-7085(01)00382-x |
[46]
offers a straightforward and cost-effective approach for the simultaneous analysis of LIS and HCT, utilizing a relatively simple mobile phase composition of chloroform, ethyl acetate, and acetic acid (10:3:2 v/v). The use of dual-wavelength detection—210 nm for LIS and 275 nm for HCT—enhances selectivity and ensures accurate quantification of each component. The reported linearity ranges of 4–20 µg/spot for LIS and 2.5–25 µg/spot for HCT suggest the method's applicability for routine quality control in pharmaceutical formulations.
However, the practicality of this method may be limited by the use of chloroform, a solvent associated with health and environmental concerns, which may require special handling and disposal measures. Additionally, the need for two different detection wavelengths may complicate the analysis setup, potentially increasing operational complexity in high-throughput environments. Despite these limitations, the method’s simplicity, relatively low solvent consumption, and adequate sensitivity make it a viable option for laboratories with limited resources or for preliminary screening purposes.
Abdelrahman et al.
| [47] | Abdelrahman, M. M., Adly, S. M., Ali, N. W., & Abdelwahab, N. S. (2019). Development and validation of different spectrophotometric and high-performance thin-layer chromatographic methods for the determination of fosinopril sodium, hydrochlorothiazide, and chlorothiazide as hydrochlorothiazide impurity. JPC–Journal of Planar Chromatography–Modern TLC, 32, 411-420. https://doi.org/10.1556/1006.2019.32.5.9 |
[47]
developed an analytical method for the simultaneous determination of FOS and HCT using a mobile phase composed of ethyl acetate, chloroform, methanol, and formic acid in a volumetric ratio of 60:40:5:0.5. Detection of both analytes was performed at 215 nm, with the method demonstrating linearity within the ranges of 1–10 µg/mL for FOS and 0.2–3 µg/mL for HCT. The reported limits of detection (LOD) were 0.28 µg/mL for FOS and 0.09 µg/mL for HCT, indicating good sensitivity, particularly for HCT.
In terms of practicality, the method offers a high level of sensitivity and a relatively wide linear range, making it suitable for the quantification of low concentrations in pharmaceutical formulations. However, the use of chloroform in the mobile phase may present challenges due to its known toxicity and environmental concerns, necessitating careful handling and disposal. Additionally, the inclusion of formic acid, while beneficial for improving peak resolution and stability, may require specialized equipment resistant to acidic conditions to prevent system degradation over time. Despite these potential limitations, the method's sensitivity, simplicity, and use of a single detection wavelength make it a practical choice for routine quality control in well-equipped laboratories.
Bhavar et al.
| [48] | Bhavar, G. B., Chatpalliwar, V. A., Patil, D. D., & Surana, S. J. (2008). Validated HPTLC method for simultaneous determination of quinapril hydrochloride and hydrochlorothiazide in a tablet dosage form. Indian Journal of Pharmaceutical Sciences, 70(4), 529. https://doi.org/10.4103/0250-474x.44612 |
[48]
successfully developed a method for the simultaneous determination of QUI and HCT using a mobile phase consisting of ethyl acetate, acetone, and acetic acid in a ratio of 6.5:3:0.5 (v/v/v). The analytes were detected at 208 nm, and the method was validated for linearity, accuracy, precision, and specificity. A strong linear relationship was observed within the concentration ranges of 400–2800 ng/spot for QUI and 500–3500 ng/spot for HCT. The limits of detection (LOD) were determined to be 123.02 ng/spot for QUI and 372.77 ng/spot for HCT, indicating moderate sensitivity. While the method provides reliable quantification across a reasonable concentration range, the relatively high LOD values suggest it may not be suitable for trace-level detection, potentially limiting its application in scenarios requiring higher sensitivity. Nonetheless, the method's simplicity and validation make it a practical choice for routine analysis in quality control settings.
3. Spectrophotometric Methods
The spectrophotometric methods reported the determination of ACE inhibitors combinations with HCT are given in Table 4.
Several spectrophotometric methods have been reported for the simultaneous determination of lisinopril (LIS) and hydrochlorothiazide (HCT), each differing in terms of sensitivity, linear range, and applicability, thus offering various options for pharmaceutical analysis.
In terms of sensitivity, the absorptivity factor and ratio subtraction methods reported by Mohammed et al.
| [49] | Mohammed, F. F., Badr El-Din, K., & Derayea, S. M. (2019). Two smart spectrophotometric methods for simultaneous determination of Lisinopril and Hydrochlorothiazide in binary mixtures. Journal of Advanced Biomedical and Pharmaceutical Sciences, 2(2), 47-53. https://doi.org/10.21608/jabps.2019.6766.1031 |
[49]
demonstrate the lowest limits of detection (LOD), with values as low as 0.297 µg/mL for HCT and 0.790 µg/mL for LIS, making these methods highly sensitive and suitable for trace-level detection. Similarly, the third derivative and ratio spectra derivative methods presented by El-Gindy et al.
| [46] | El-Gindy, A., Ashour, A., Abdel-Fattah, L., & Shabana, M. M. (2001). Spectrophotometric and HPTLC-densitometric determination of lisinopril and hydrochlorothiazide in binary mixtures. Journal of Pharmaceutical and Biomedical Analysis, 25(5-6), 923-931. https://doi.org/10.1016/s0731-7085(01)00382-x |
[46]
provide relatively good sensitivity, with LOD values ranging between 0.2–1.5 µg/mL for LIS and 0.2–0.4 µg/mL for HCT, ensuring reliable detection in low concentrations. On the other hand, the absorbance ratio method by Erk et al.
| [29] | Erk, N., & Kartal, M. (1999). Comparison of high-performance liquid chromatography and absorbance ratio methods for the determination of hydrochlorothiazide and lisinopril in pharmaceutical formulations. Analytical Letters, 32(6), 1131-1141. https://doi.org/10.1080/00032719908542883 |
[29]
does not report LOD values, making it difficult to assess its sensitivity compared to the other techniques.
The absorbance ratio method exhibits the broadest range, covering 16.0–130.0 µg/mL for LIS and 6.0–140.0 µg/mL for HCT, which makes it well-suited for quality control purposes where a wide range of concentrations may be encountered. In contrast, the third derivative and ratio spectra derivative methods offer narrower working ranges of 8–56 µg/mL for LIS and 5–20 µg/mL for HCT, making them more applicable for precise quantification in lower concentration ranges. The absorptivity factor and ratio subtraction methods provide intermediate linear ranges, covering 2.5–30.0 µg/mL for LIS and 1.0–20.0 µg/mL for HCT, balancing the need for both sensitivity and practical concentration limits.
All methods utilize methanol as a solvent, ensuring ease of sample preparation and compatibility with standard spectrophotometric equipment. The absorbance ratio method is advantageous for routine analysis due to its broad working range, making it suitable for high-dose formulations and routine quality control. The absorptivity factor and ratio subtraction methods, with their superior sensitivity and moderate range, are ideal for detecting low concentrations in both quality control and bioanalytical applications. Meanwhile, the third derivative and ratio spectra derivative methods offer enhanced selectivity and sensitivity but may require more complex data processing, which could limit their routine application in standard laboratories.
In conclusion, the choice of method depends on the specific analytical requirements. For applications demanding high sensitivity, the absorptivity factor and ratio subtraction methods are preferred. If a broad quantification range is needed, the absorbance ratio method provides the most versatility, whereas the third derivative and ratio spectra derivative methods are best suited for more precise low-range quantifications with improved selectivity.
Several spectrophotometric methods have been developed for the simultaneous determination of fosinopril (FOS) and hydrochlorothiazide (HCT) combination, with differences in sensitivity, linear range, and applicability, providing diverse options for pharmaceutical analysis.
The derivative differential, ratio spectra derivative, and absorbance ratio methods reported by Erk
| [50] | Erk, N. (2002). Simultaneous determination of fosinopril and hydrochlorothiazide in pharmaceutical formulations by spectrophotometric methods. Journal of Pharmaceutical and Biomedical Analysis, 27(6), 901-912. https://doi.org/10.1016/s0731-7085(01)00628-8 |
[50]
exhibit the lowest limits of detection (LOD), with values as low as 0.052 µg/mL for FOS and 0.120 µg/mL for HCT, indicating their high sensitivity and suitability for detecting trace amounts of the drugs. The ratio difference and mean centering methods by Abdelrahman et al.
| [47] | Abdelrahman, M. M., Adly, S. M., Ali, N. W., & Abdelwahab, N. S. (2019). Development and validation of different spectrophotometric and high-performance thin-layer chromatographic methods for the determination of fosinopril sodium, hydrochlorothiazide, and chlorothiazide as hydrochlorothiazide impurity. JPC–Journal of Planar Chromatography–Modern TLC, 32, 411-420. https://doi.org/10.1556/1006.2019.32.5.9 |
[47]
show slightly higher LOD values, with FOS detected at 1.11 µg/mL and HCT at 0.73 µg/mL, which still provides adequate sensitivity for routine quality control. The fourth derivative method described by Saglik et al.
| [32] | Saglik, S., Sagirli, O., Atmaca, S., & Ersoy, L. (2001). Simultaneous determination of fosinopril and hydrochlorothiazide in tablets by derivative spectrophotometric and high-performance liquid chromatographic methods. Analytica chimica acta, 427(2), 253-257. https://doi.org/10.1016/s0003-2670(00)01201-0 |
[32]
does not report LOD values, making it difficult to directly compare its sensitivity to the other methods.
The linear range, the derivative differential, ratio spectra derivative, and absorbance ratio methods
| [50] | Erk, N. (2002). Simultaneous determination of fosinopril and hydrochlorothiazide in pharmaceutical formulations by spectrophotometric methods. Journal of Pharmaceutical and Biomedical Analysis, 27(6), 901-912. https://doi.org/10.1016/s0731-7085(01)00628-8 |
[50]
cover the broadest range of 4.0–50.0 µg/mL for FOS and 2.0–14.0 µg/mL for HCT, making them ideal for applications requiring flexibility in concentration levels. The fourth derivative method offers a similar working range of 5.0–45.0 µg/mL for FOS and 0.5–9.0 µg/mL for HCT, which suggests it may be better suited for lower HCT concentrations. In contrast, the ratio difference and mean centering methods provide a narrower range of 4.0–35.0 µg/mL for FOS and 2.0–15.0 µg/mL for HCT, which may be sufficient for standard pharmaceutical formulations but could limit their application in formulations with a wider concentration range.
From an applicability standpoint, all methods primarily utilize methanol as the solvent, ensuring ease of sample preparation and compatibility with standard laboratory equipment. However, Erk’s methods employ a methanol/0.1 N NaOH mixture, which may enhance solubility and stability, potentially improving the accuracy of measurements in complex matrices. The fourth derivative method provides a straightforward approach that can be easily implemented in routine quality control laboratories, while the ratio difference and mean centering methods offer greater selectivity and accuracy by minimizing spectral interference. The derivative differential, ratio spectra derivative, and absorbance ratio methods, despite their complexity, provide the most comprehensive analysis with superior sensitivity and broader linear ranges, making them suitable for both routine and advanced pharmaceutical analysis.
In conclusion, for applications demanding the highest sensitivity and broadest working range, the derivative differential, ratio spectra derivative, and absorbance ratio methods by Erk
| [50] | Erk, N. (2002). Simultaneous determination of fosinopril and hydrochlorothiazide in pharmaceutical formulations by spectrophotometric methods. Journal of Pharmaceutical and Biomedical Analysis, 27(6), 901-912. https://doi.org/10.1016/s0731-7085(01)00628-8 |
[50]
are the preferred choices. The ratio difference and mean centering methods
| [47] | Abdelrahman, M. M., Adly, S. M., Ali, N. W., & Abdelwahab, N. S. (2019). Development and validation of different spectrophotometric and high-performance thin-layer chromatographic methods for the determination of fosinopril sodium, hydrochlorothiazide, and chlorothiazide as hydrochlorothiazide impurity. JPC–Journal of Planar Chromatography–Modern TLC, 32, 411-420. https://doi.org/10.1556/1006.2019.32.5.9 |
[47]
provide a balance between sensitivity and ease of use, while the fourth derivative method offers a simpler approach with adequate sensitivity for routine quality control.
The spectrophotometric methods developed for the determination of ramipril (RAM) and hydrochlorothiazide (HCT) in tablet formulations differ in terms of sensitivity and practical applicability, each offering distinct advantages depending on the analytical requirements.
In terms of sensitivity, the absorbance correction method reported by De et al.
| [52] | De, A., Dey, S., Jha, A., & Mandal, K. (2014). UV spectrophotometric methods for estimation of ramipril and hydrochlorothiazide by absorbance correction method. Indo American Journal of Pharmaceutical Research, 4(5), 2503-2513. |
[52]
demonstrates superior performance, with a limit of detection (LOD) of 0.05 µg/mL for both RAM and HCT. This high sensitivity makes it suitable for the quantification of low concentrations, which is crucial for trace-level analysis in pharmaceutical formulations. On the other hand, the simultaneous equation and area under curve (AUC) methods described by Tambe et al.
| [51] | Tambe, V., Vishare, V., Kandekar, U., & Dhole, S. (2010). Novel UV spectrophotometric methods for estimation of ramipril and hydrochlorothiazide by simultaneous equation and area under curve method. Int J Appl Pharm, 2(4), 20-22. |
[51]
do not report LOD values, which makes direct sensitivity comparison difficult. However, the reported linear ranges of 0.1–3.5 µg/mL for RAM and 0.5–17.5 µg/mL for HCT suggest that these methods may still provide adequate sensitivity for routine quality control applications.
From a practical standpoint, the simultaneous equation and AUC methods offer a straightforward and cost-effective approach, using water as a solvent, which is environmentally friendly and readily available. This makes them highly suitable for routine pharmaceutical quality control, where simplicity and cost-efficiency are key considerations. Furthermore, the AUC method provides the advantage of integrating a range of wavelengths, which can help minimize the effects of minor spectral variations and improve method robustness.
While, the absorbance correction method, which utilizes ethanol as a solvent, provides higher sensitivity and specificity, making it particularly useful for the precise quantification of low-concentration samples. However, the use of ethanol, while offering good solubility and stability, may introduce additional costs and require careful handling due to its volatility and potential safety concerns. Despite these factors, the absorbance correction method's ability to achieve a narrower linear range (0.1–0.5 µg/mL for RAM and 0.25–1.25 µg/mL for HCT) makes it particularly suitable for applications where precise quantification of low concentrations is required.
In conclusion, the choice between these methods depends on the specific analytical needs. The simultaneous equation and AUC methods are well-suited for routine analysis due to their simplicity, cost-effectiveness, and environmentally friendly solvent use. Meanwhile, the absorbance correction method offers greater sensitivity and precision, making it the preferred choice for applications requiring lower detection limits and higher specificity.
The spectrophotometric methods employed for the determination of benazepril (BEN) and hydrochlorothiazide (HCT) in tablet formulations demonstrate varying degrees of sensitivity and practicality, making them suitable for different analytical needs.
In terms of sensitivity, the second derivative method reported by Panderi et al.
| [53] | Panderi, I., & Parissi-Poulou, M. (1992). Determination of captopril and captopril-hydrochlorothiazide combination in tablets by derivative UV spectrophotometry. International Journal of Pharmaceutics, 86(2-3), 99-106. https://doi.org/10.1016/0378-5173(92)90185-5 |
[53]
, which utilizes 0.1 M HCl as the solvent, exhibits relatively higher limits of detection (LOD), with 2.46 µg/mL for BEN and 1.57 µg/mL for HCT. This suggests that the method is more suited for routine quality control where ultra-trace detection is not critical. In contrast, the methods reported by El-Gindy
| [54] | El-Gindy, A., Ashour, A., Abdel-Fattah, L., & Shabana, M. M. (2001). Spectrophotometric determination of benazepril hydrochloride and hydrochlorothiazide in binary mixture using second derivative, second derivative of the ratio spectra and chemometric methods. Journal of Pharmaceutical and Biomedical Analysis, 25(2), 299-307. https://doi.org/10.1016/s0731-7085(00)00502-1 |
[54]
, which include second derivative, ratio spectra derivative, classical least squares, and principal component regression techniques using methanol as the solvent, demonstrate significantly lower LOD values. Among these, the ratio spectra derivative method shows the highest sensitivity, with LODs of 0.3 µg/mL for BEN and 0.2 µg/mL for HCT, making it a more appropriate choice for trace-level analysis. The other techniques within the same study offer LOD values ranging from 0.6 to 0.8 µg/mL for BEN and 0.1 to 0.5 µg/mL for HCT, which still provide enhanced sensitivity compared to the second derivative method in
| [53] | Panderi, I., & Parissi-Poulou, M. (1992). Determination of captopril and captopril-hydrochlorothiazide combination in tablets by derivative UV spectrophotometry. International Journal of Pharmaceutics, 86(2-3), 99-106. https://doi.org/10.1016/0378-5173(92)90185-5 |
[53]
.
The simultaneous equation and ratio spectra derivative methods described by Erk
| [55] | Erk, N. (1999). Determination of active ingredients in the pharmaceutical formulations containing hydrochlorothiazide and its binary mixtures with benazepril hydrochloride, triamterene and cilazapril by ratio spectra derivative spectrophotometry and vierordt’s method. Journal of Pharmaceutical and Biomedical Analysis, 20(1-2), 155-167. https://doi.org/10.1016/s0731-7085(99)00009-6 |
[55]
, using a mixed solvent system of methanol and 0.1 N HCl (1:1), did not report LOD values, making it difficult to assess their sensitivity directly. However, the reported linear ranges of 8.0–36.0 µg/mL for BEN and 2.0–28.0 µg/mL for HCT indicate that the method may provide sufficient sensitivity for standard pharmaceutical analysis.
From a practicality standpoint, the second derivative method in
| [53] | Panderi, I., & Parissi-Poulou, M. (1992). Determination of captopril and captopril-hydrochlorothiazide combination in tablets by derivative UV spectrophotometry. International Journal of Pharmaceutics, 86(2-3), 99-106. https://doi.org/10.1016/0378-5173(92)90185-5 |
[53]
offers a straightforward approach with minimal solvent requirements and simple instrumentation, making it ideal for routine quality control settings. However, the relatively narrow linear range (14.80–33.80 µg/mL for BEN and 18.50–42.20 µg/mL for HCT) may limit its flexibility in handling varying sample concentrations.
The methods reported in
| [54] | El-Gindy, A., Ashour, A., Abdel-Fattah, L., & Shabana, M. M. (2001). Spectrophotometric determination of benazepril hydrochloride and hydrochlorothiazide in binary mixture using second derivative, second derivative of the ratio spectra and chemometric methods. Journal of Pharmaceutical and Biomedical Analysis, 25(2), 299-307. https://doi.org/10.1016/s0731-7085(00)00502-1 |
[54]
, which include multiple analytical approaches, provide greater flexibility and adaptability for comprehensive analysis. The use of methanol as a solvent enhances solubility and method robustness, making them practical for laboratories equipped with standard UV-visible spectrophotometers. However, the complexity of data processing in techniques such as classical least squares and principal component regression may require specialized software and trained personnel, which could impact routine implementation.
The simultaneous equation and ratio spectra derivative methods in
| [55] | Erk, N. (1999). Determination of active ingredients in the pharmaceutical formulations containing hydrochlorothiazide and its binary mixtures with benazepril hydrochloride, triamterene and cilazapril by ratio spectra derivative spectrophotometry and vierordt’s method. Journal of Pharmaceutical and Biomedical Analysis, 20(1-2), 155-167. https://doi.org/10.1016/s0731-7085(99)00009-6 |
[55]
offer a practical compromise, as they utilize a mixed solvent system that can enhance method performance by improving solubility and minimizing matrix effects. These methods provide wider linear ranges (8.0–36.0 µg/mL for BEN and 2.0–28.0 µg/mL for HCT), making them suitable for diverse sample concentrations encountered in pharmaceutical quality control. Additionally, their straightforward analytical approach makes them accessible for routine applications without extensive training or complex instrumentation.
A single method was also described for the determination of HCT with each of CAP
| [56] | Dawood, A. G., Habeeb, N. N., & Omer, L. S. (2021). H-point Standard Addition Method for the Simultaneous Spectrophotometric Determination of Captopril and Hydrochlorothiazide in Pharmaceutical Formulations. Jordan Journal of Chemistry (JJC), 16(2), 77-85. doi:10.47014/16.2.4 |
[56]
, ZOF
| [57] | Carlucci, G., Di Federico, L. U. C. I. A., & Iuliani, P. (2010). Simultaneous determination of zofenopril and hydrochlorothiazide in tablets using derivative UV spectrophotometry. Analytical Letters, 43(16), 2609-2617. https://doi.org/10.1080/00032711003731415 |
[57]
and QUI
| [58] | Kowalczuk, D., & Hopkała, H. (2004). Application of derivative spectrophotometry for simultaneous determination of quinapril and hydrochlorothiazide in the combination tablets. Journal of AOAC International, 87(4), 847-851. https://doi.org/10.1093/jaoac/87.4.847 |
[58]
.
For routine quality control where simplicity and ease of use are prioritized, the second derivative method in
| [53] | Panderi, I., & Parissi-Poulou, M. (1992). Determination of captopril and captopril-hydrochlorothiazide combination in tablets by derivative UV spectrophotometry. International Journal of Pharmaceutics, 86(2-3), 99-106. https://doi.org/10.1016/0378-5173(92)90185-5 |
[53]
is a practical choice. However, for applications requiring higher sensitivity and broader analytical capabilities, the techniques reported in
| [54] | El-Gindy, A., Ashour, A., Abdel-Fattah, L., & Shabana, M. M. (2001). Spectrophotometric determination of benazepril hydrochloride and hydrochlorothiazide in binary mixture using second derivative, second derivative of the ratio spectra and chemometric methods. Journal of Pharmaceutical and Biomedical Analysis, 25(2), 299-307. https://doi.org/10.1016/s0731-7085(00)00502-1 |
[54]
provide a more comprehensive solution, albeit with increased complexity. The simultaneous equation and ratio spectra derivative methods in
| [55] | Erk, N. (1999). Determination of active ingredients in the pharmaceutical formulations containing hydrochlorothiazide and its binary mixtures with benazepril hydrochloride, triamterene and cilazapril by ratio spectra derivative spectrophotometry and vierordt’s method. Journal of Pharmaceutical and Biomedical Analysis, 20(1-2), 155-167. https://doi.org/10.1016/s0731-7085(99)00009-6 |
[55]
offer a balanced option with good linear range coverage and ease of application, making them well-suited for routine analysis in pharmaceutical settings.